
infoviz.cz
 infoviz
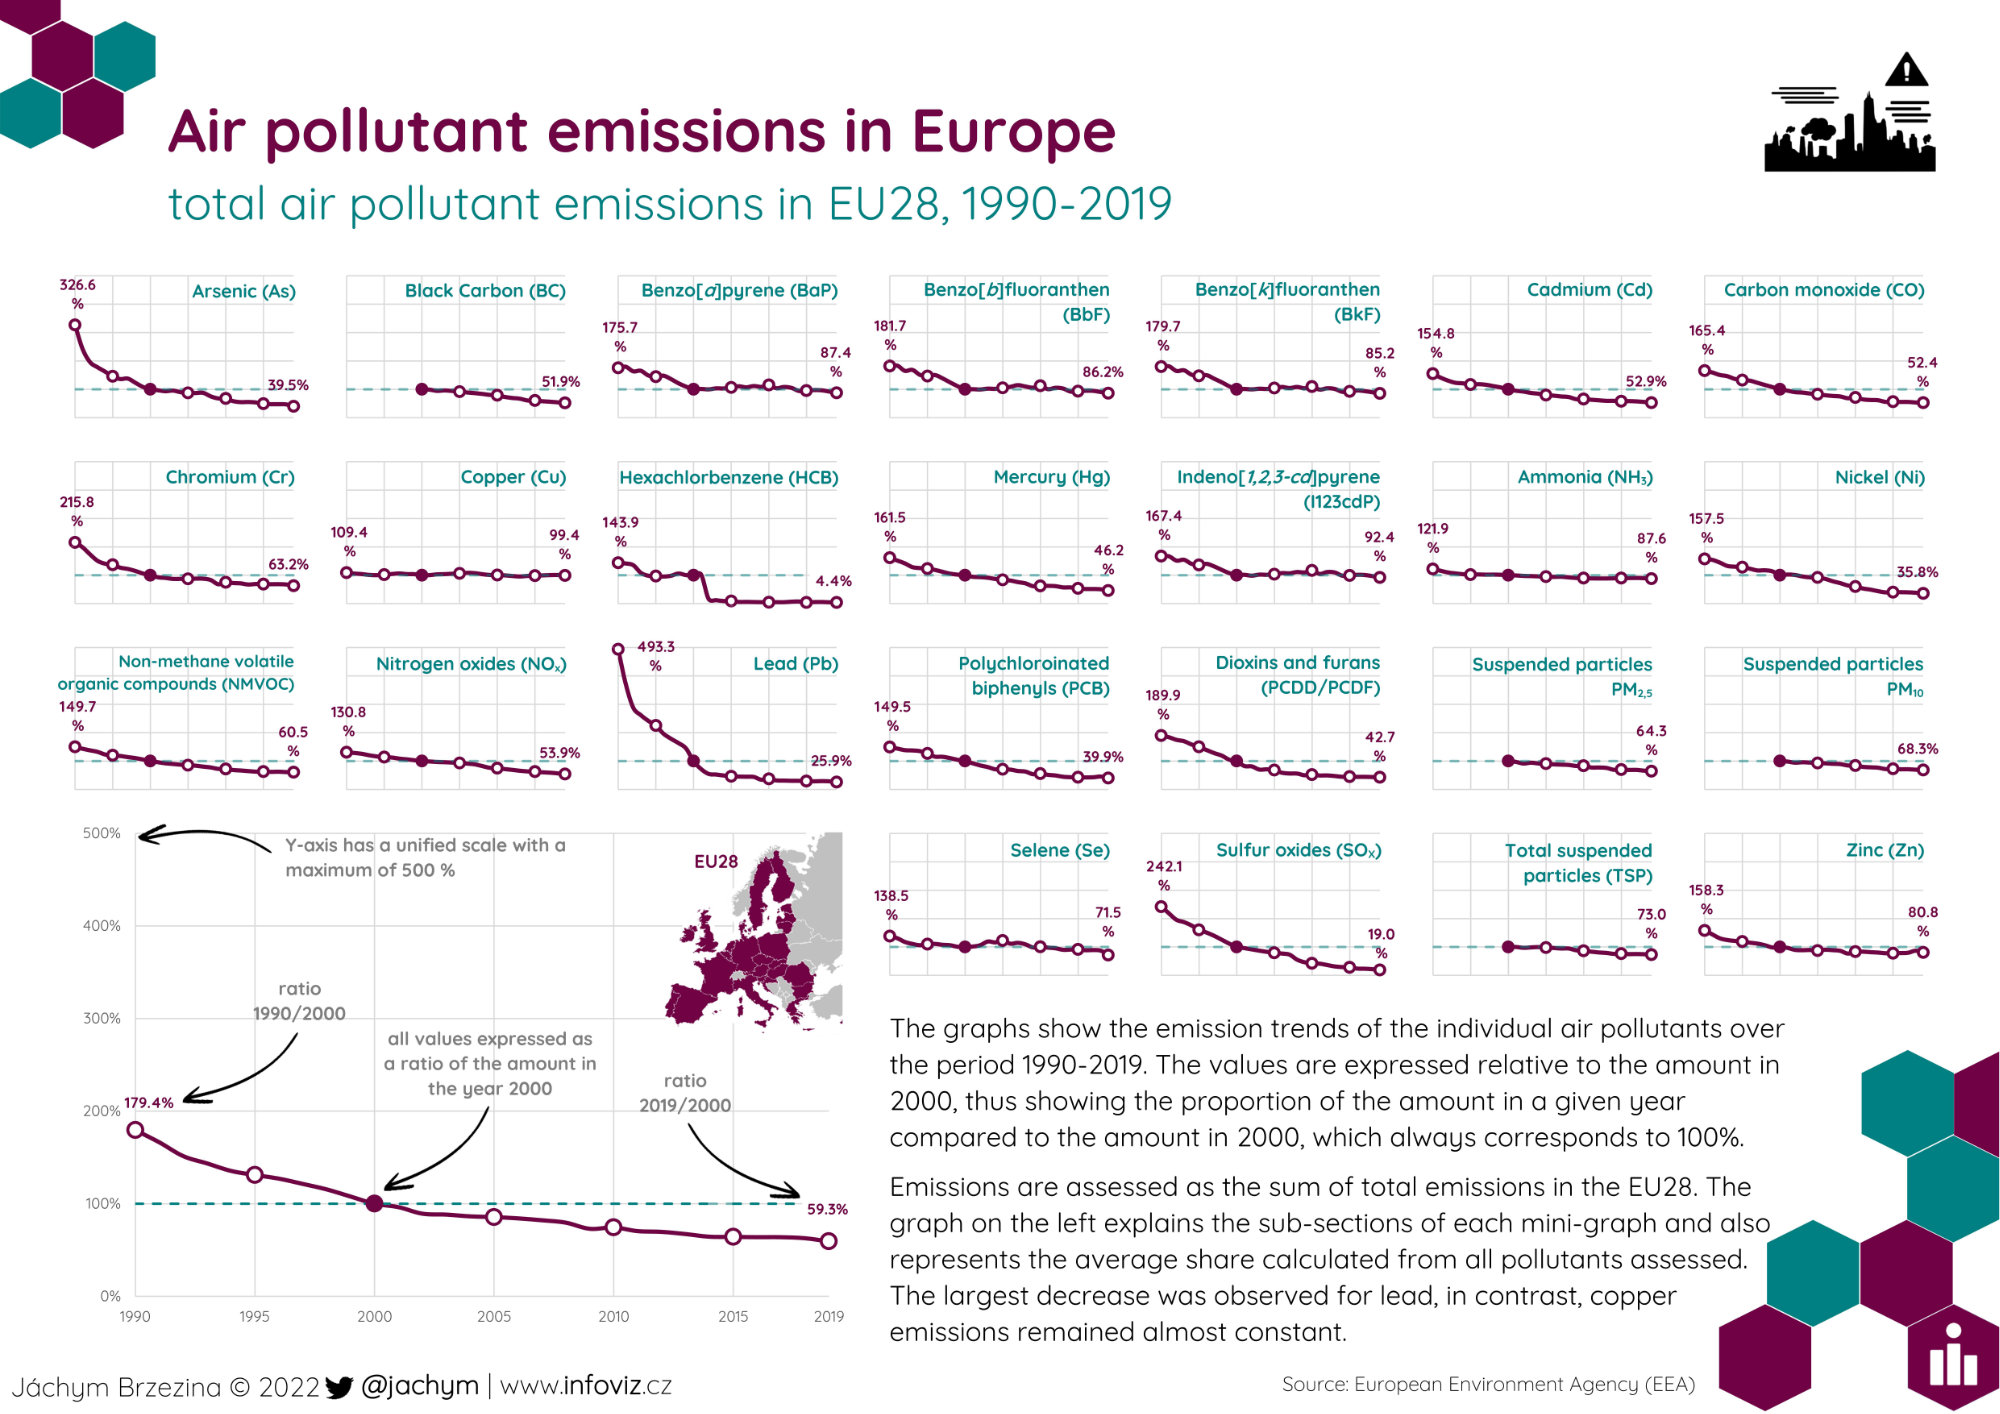
The graphs show the emission trends of the individual air pollutants over the period 1990-2019. The values are expressed relative to the amount in 2000, thus showing the proportion of the amount in a given year compared to the amount in 2000, which always corresponds to 100%.
Emissions are assessed as the sum of total emissions in the EU28. The graph on the left explains the sub-sections of each mini-graph and also represents the average share calculated from all pollutants assessed. The largest decrease was observed for lead, in contrast, copper emissions remained almost constant.
